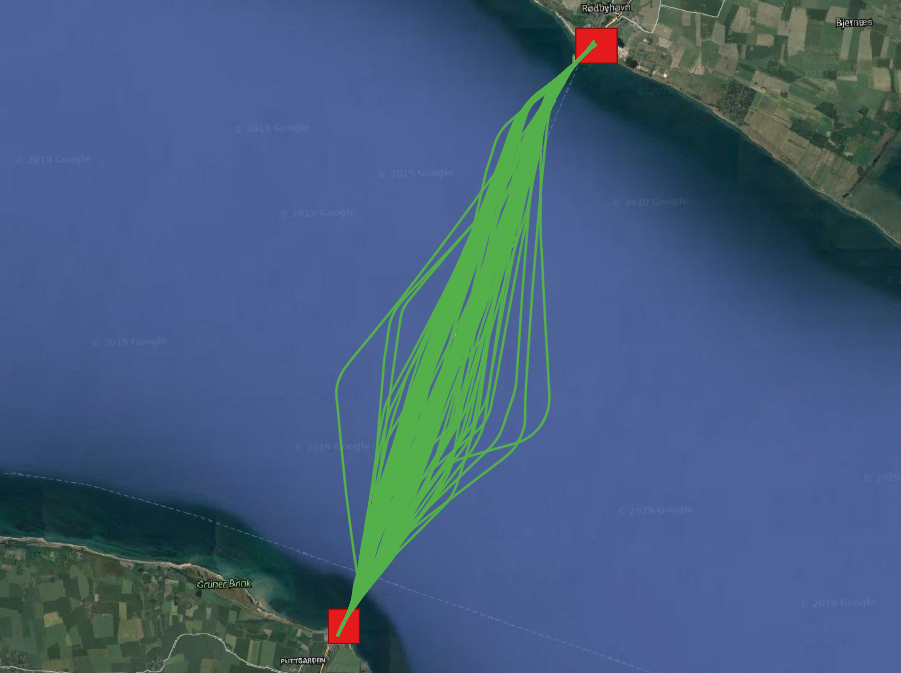
Now we dive into MobilityDB and explore more of its functions. In Figure 1.7, “A sample ship trajectory between Rødby and Puttgarden”, we notice trajectories that keep going between Rødby and Puttgarden. Most probably, these are the ferries between the two ports. The task is simply to spot which Ships do so, and to count how many one way trips they did in this day. This is expressed in the following query:
CREATE INDEX Ships_Trip_Idx ON Ships USING GiST(Trip);

WITH Ports(Rodby, Puttgarden) AS (
  SELECT ST_MakeEnvelope(651135, 6058230, 651422, 6058548, 25832),
    ST_MakeEnvelope(644339, 6042108, 644896, 6042487, 25832)
)
SELECT S.*, Rodby, Puttgarden
FROM Ports P, Ships S
WHERE intersects(S.Trip, P.Rodby) AND intersects(S.Trip, P.Puttgarden)
--Total query runtime: 462 msec
--4 rows retrieved.
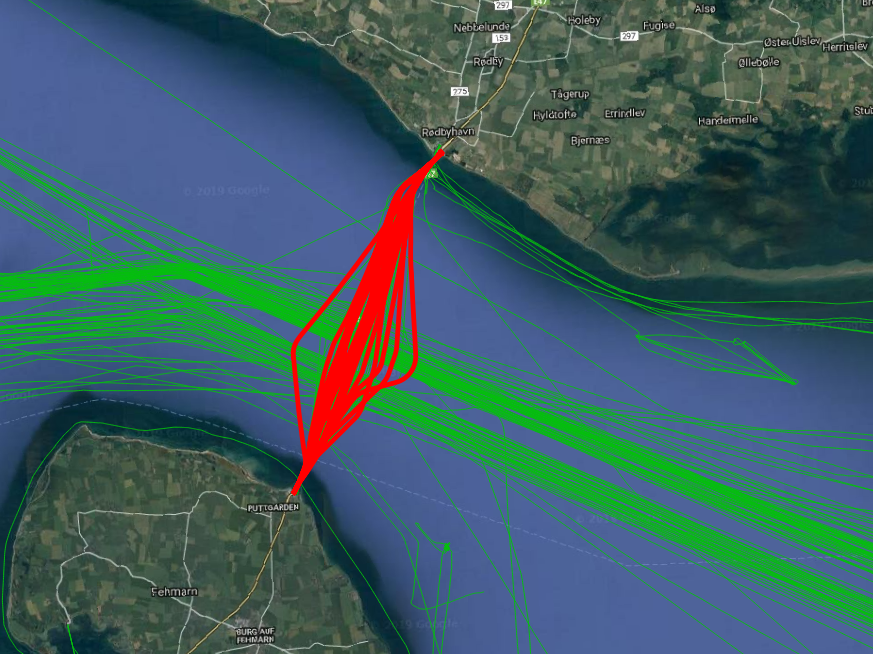
This query creates two envelope geometries that represent the locations of the two ports, then intersects them with the spatiotemporal trajectories of the ships. The intersects function checks whether a temporal point has ever intersects a geometry. To speed up the query, a spatiotemporal GiST index is first built on the Trip attribute. The query identified four Ships that commuted between the two ports, Figure 1.8, “All ferries between Rødby and Puttgarden”. To count how many one way trips each of them did, we extend the previous query as follows:
WITH Ports(Rodby, Puttgarden) AS (
  SELECT ST_MakeEnvelope(651135, 6058230, 651422, 6058548, 25832),
    ST_MakeEnvelope(644339, 6042108, 644896, 6042487, 25832)
)
SELECT MMSI, (numSequences(atGeometry(S.Trip, P.Rodby)) +
  numSequences(atGeometry(S.Trip, P.Puttgarden)))/2.0 AS NumTrips
FROM Ports P, Ships S
WHERE intersects(S.Trip, P.Rodby) AND intersects(S.Trip, P.Puttgarden)
--Total query runtime: 1.1 secs

MMSI		NumTrips
219000429;  24.0
211188000;  24.0
211190000;  25.0
219000431;  16.0
The function atGeometry restricts the temporal point to the parts where it is inside the given geometry. The result is thus a temporal point that consists of multiple pieces (sequences), with temporal gaps in between. The function numSequences counts the number of these pieces.
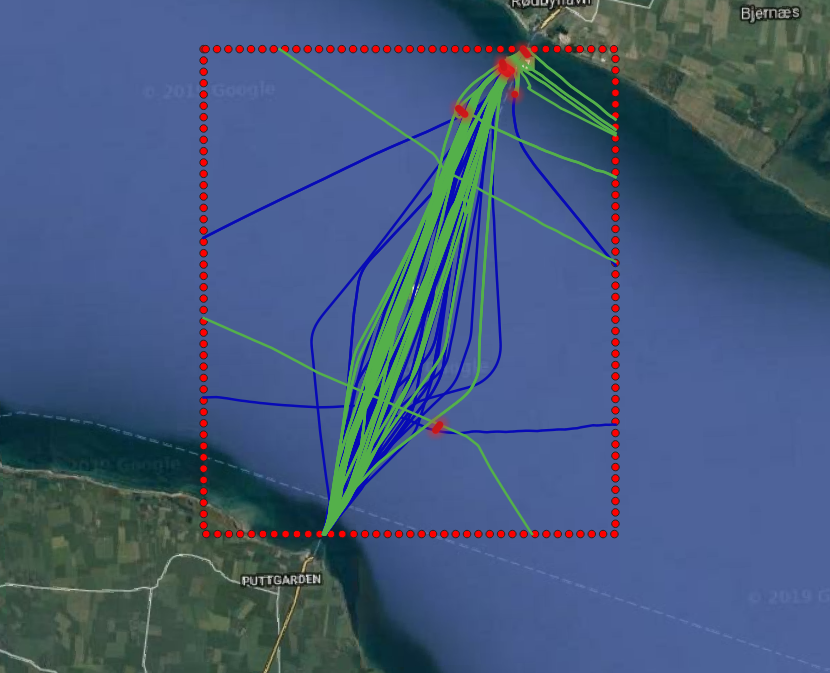
With this high number of ferry trips, one wonders whether there are collision risks with ships that traverse this belt (the green trips in Figure 1.7, “A sample ship trajectory between Rødby and Puttgarden”). To check this, we query whether a pair of ship come very close to one another as follows:
WITH B(Belt) AS (
  SELECT ST_MakeEnvelope(640730, 6058230, 654100, 6042487, 25832)
),
BeltShips AS (
  SELECT MMSI, atGeometry(S.Trip, B.Belt) AS Trip,
    trajectory(atGeometry(S.Trip, B.Belt)) AS Traj
  FROM Ships S, B
  WHERE intersects(S.Trip, B.Belt)
)
SELECT S1.MMSI, S2.MMSI, S1.Traj, S2.Traj, shortestLine(S1.trip, S2.trip) Approach
FROM BeltShips S1, BeltShips S2
WHERE S1.MMSI > S2.MMSI AND
dwithin(S1.trip, S2.trip, 300)
--Total query runtime: 28.5 secs
--7 rows retrieved.
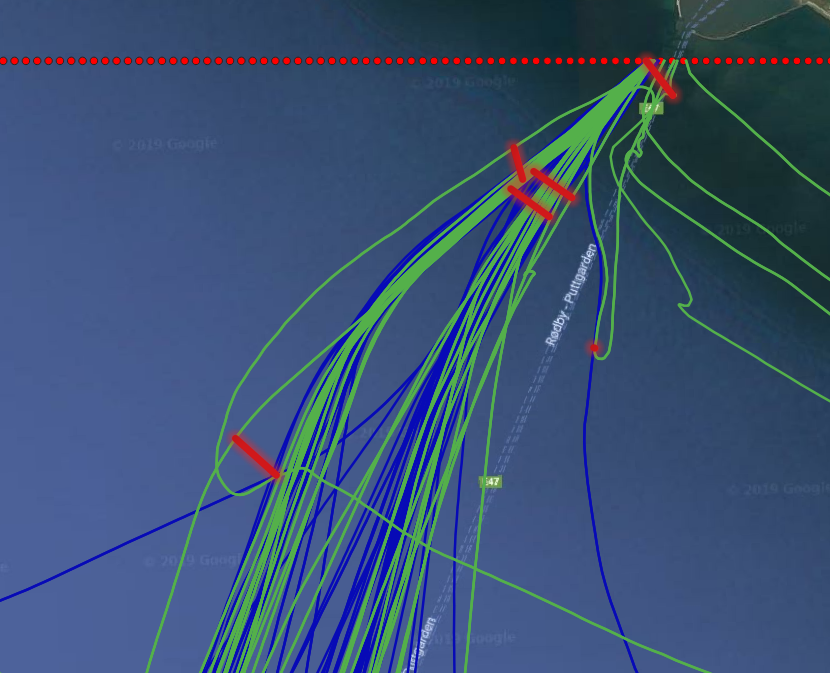
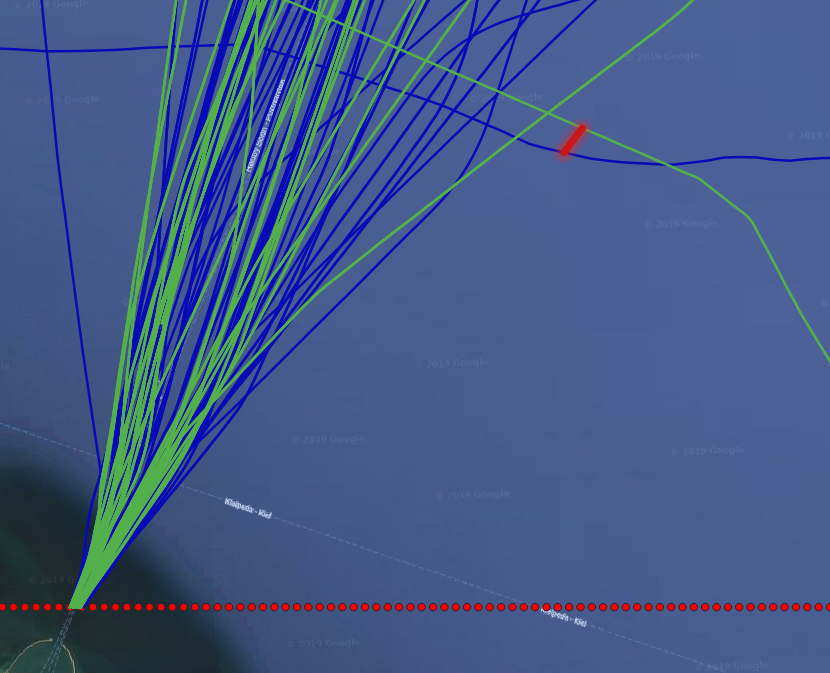
The query first defines the area of interest as an envelope, the red dashed line in Figure 1.9, “Ship that come closer than 300 meters to one another”). It then restricts/crops the trajectories to only this envelope using the atGeometry function. The main query then find pairs of different trajectories that ever came within a distance of 300 meters to one another (the dwithin). For these trajectories, it computes the spatial line that connects the two instants where the two trajectories were closest to one another (the shortestLine function). Figure 1.9, “Ship that come closer than 300 meters to one another” shows the green trajectories that came close to the blue trajectories, and their shortest connecting line in solid red. Most of the approaches occur at the entrance of the Rødby port, which looks normal. But we also see two interesting approaches, that may indicate danger of collision away from the port. They are shown with more zoom in Figure 1.10, “A zoom-in on a dangerous approach” and Figure 1.11, “Another dangerous approach”